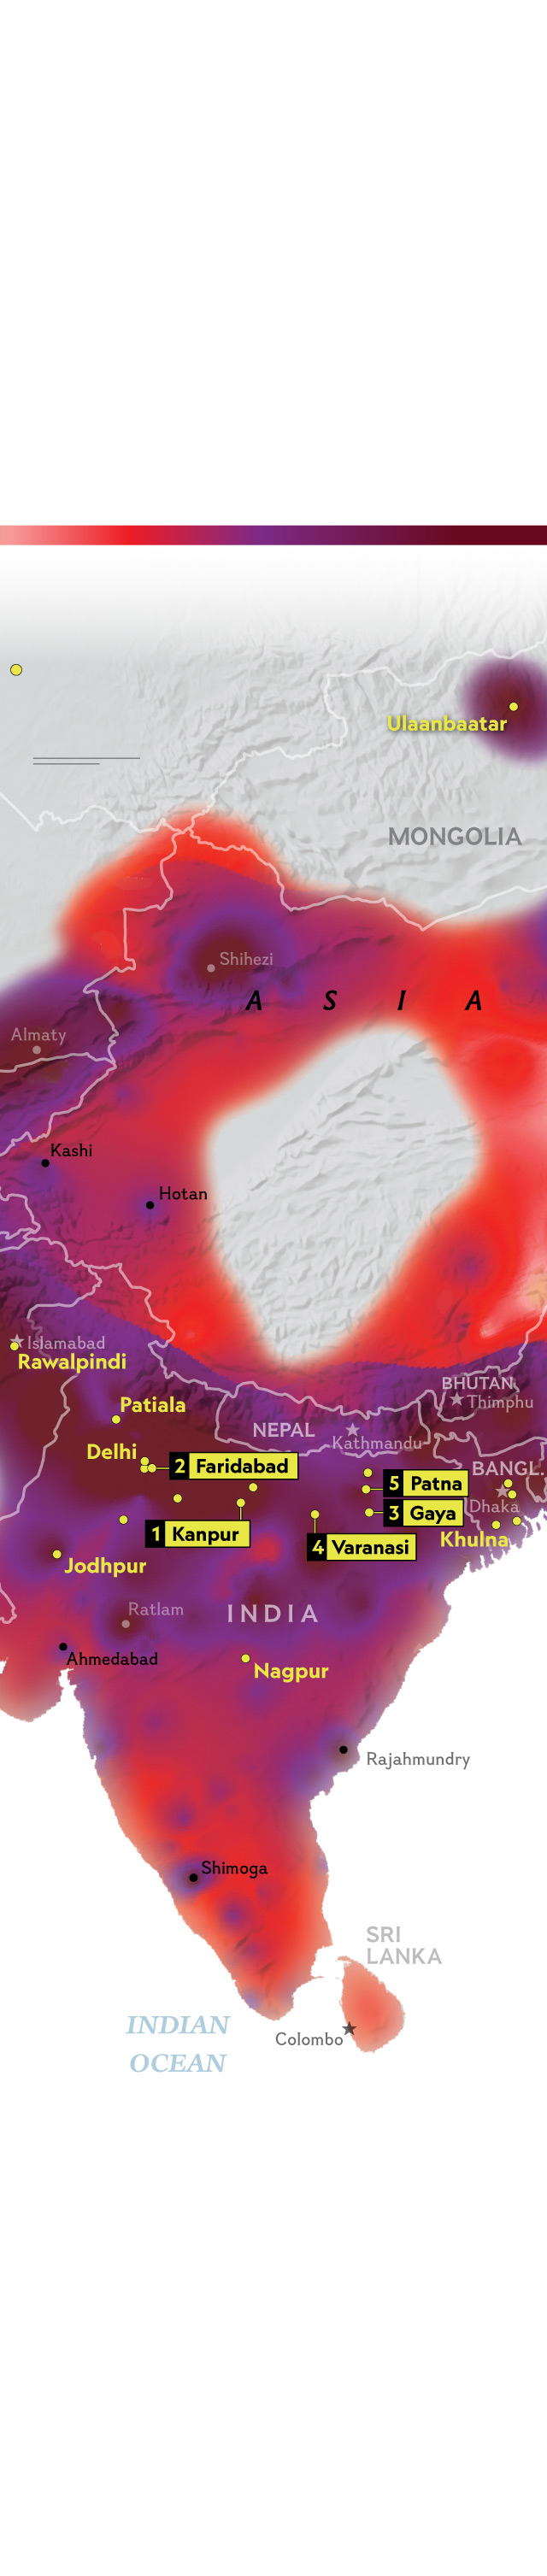
Disparity in the Air
People in some of the world’s most populous countries—China, India, Pakistan— breathe the most polluted air. This map shows readings of PM2.5, or fine-particulate matter, recorded over several months in 2020, with the highest readings selected for each place. Of the world’s 50 most polluted cities, nearly all are in Asia.
PM2.5 air pollution
by U.S. Air Quality Index health category
101
151
201
301+
Unhealthy
for sensitive
groups
Unhealthy
Very
unhealthy
Hazardous
Among the 50 most
polluted cities
250 mi
250 km
Gray areas have
insufficient surface
stations to estimate
air quality conditions.
RYAN MORRIS, NGM STAFF. SOURCES: BERKELEY EARTH; WORLD HEALTH ORGANIZATION; IQAIR; STATE OF GLOBAL AIR 2020
NOTE: THE MAP SHOWS A COMPOSITE OF THE HIGHEST PM2.5 READINGS FROM THOUSANDS OF SURFACE STATION MEASUREMENTS SAMPLED AT DAILY INTERVALS BETWEEN OCTOBER 2020 AND JANUARY 2021. THE DATA ARE EXTRAPOLATED TO CREATE AN ESTIMATE OF THE WORST AIR QUALITY CONDITIONS EXPERIENCED BY REGION. HEALTH CATEGORIES ARE BASED ON THE EPA’S STANDARD FOR 24-HOUR EXPOSURE.
Disparity in the Air
People in some of the world’s most populous countries—China, India, Pakistan— breathe the most polluted air. This map shows readings of PM2.5, or fine-particulate matter, recorded over several months in 2020, with the highest readings selected for each place. Of the world’s 50 most polluted cities, nearly all are in Asia.
CHINA
Government action has decreased ambient levels of PM2.5 by 30 percent during the past decade, yet 1.4 million Chinese died of exposure to it in 2019. Coal and diesel fuel are key sources of PM2.5 here.
Gray areas have
insufficient surface
stations to estimate
air quality conditions.
INDIA
Delhi’s skies are choked with annual PM2.5 levels nearly 10 times the target set by the World Health Organization.
PAKISTAN
With its large population and low standards for auto and industry emissions, Pakistan ranks second worst when it comes to PM2.5 exposure.
RYAN MORRIS, NGM STAFF. SOURCES: BERKELEY EARTH; WORLD HEALTH ORGANIZATION; IQAIR; STATE OF GLOBAL AIR 2020
NOTE: THE MAP SHOWS A COMPOSITE OF THE HIGHEST PM2.5 READINGS FROM THOUSANDS OF SURFACE STATION MEASUREMENTS SAMPLED AT DAILY INTERVALS BETWEEN OCTOBER 2020 AND JANUARY 2021. THE DATA ARE EXTRAPOLATED TO CREATE AN ESTIMATE OF THE WORST AIR QUALITY CONDITIONS EXPERIENCED BY REGION. HEALTH CATEGORIES ARE BASED ON THE EPA’S STANDARD FOR 24-HOUR EXPOSURE.
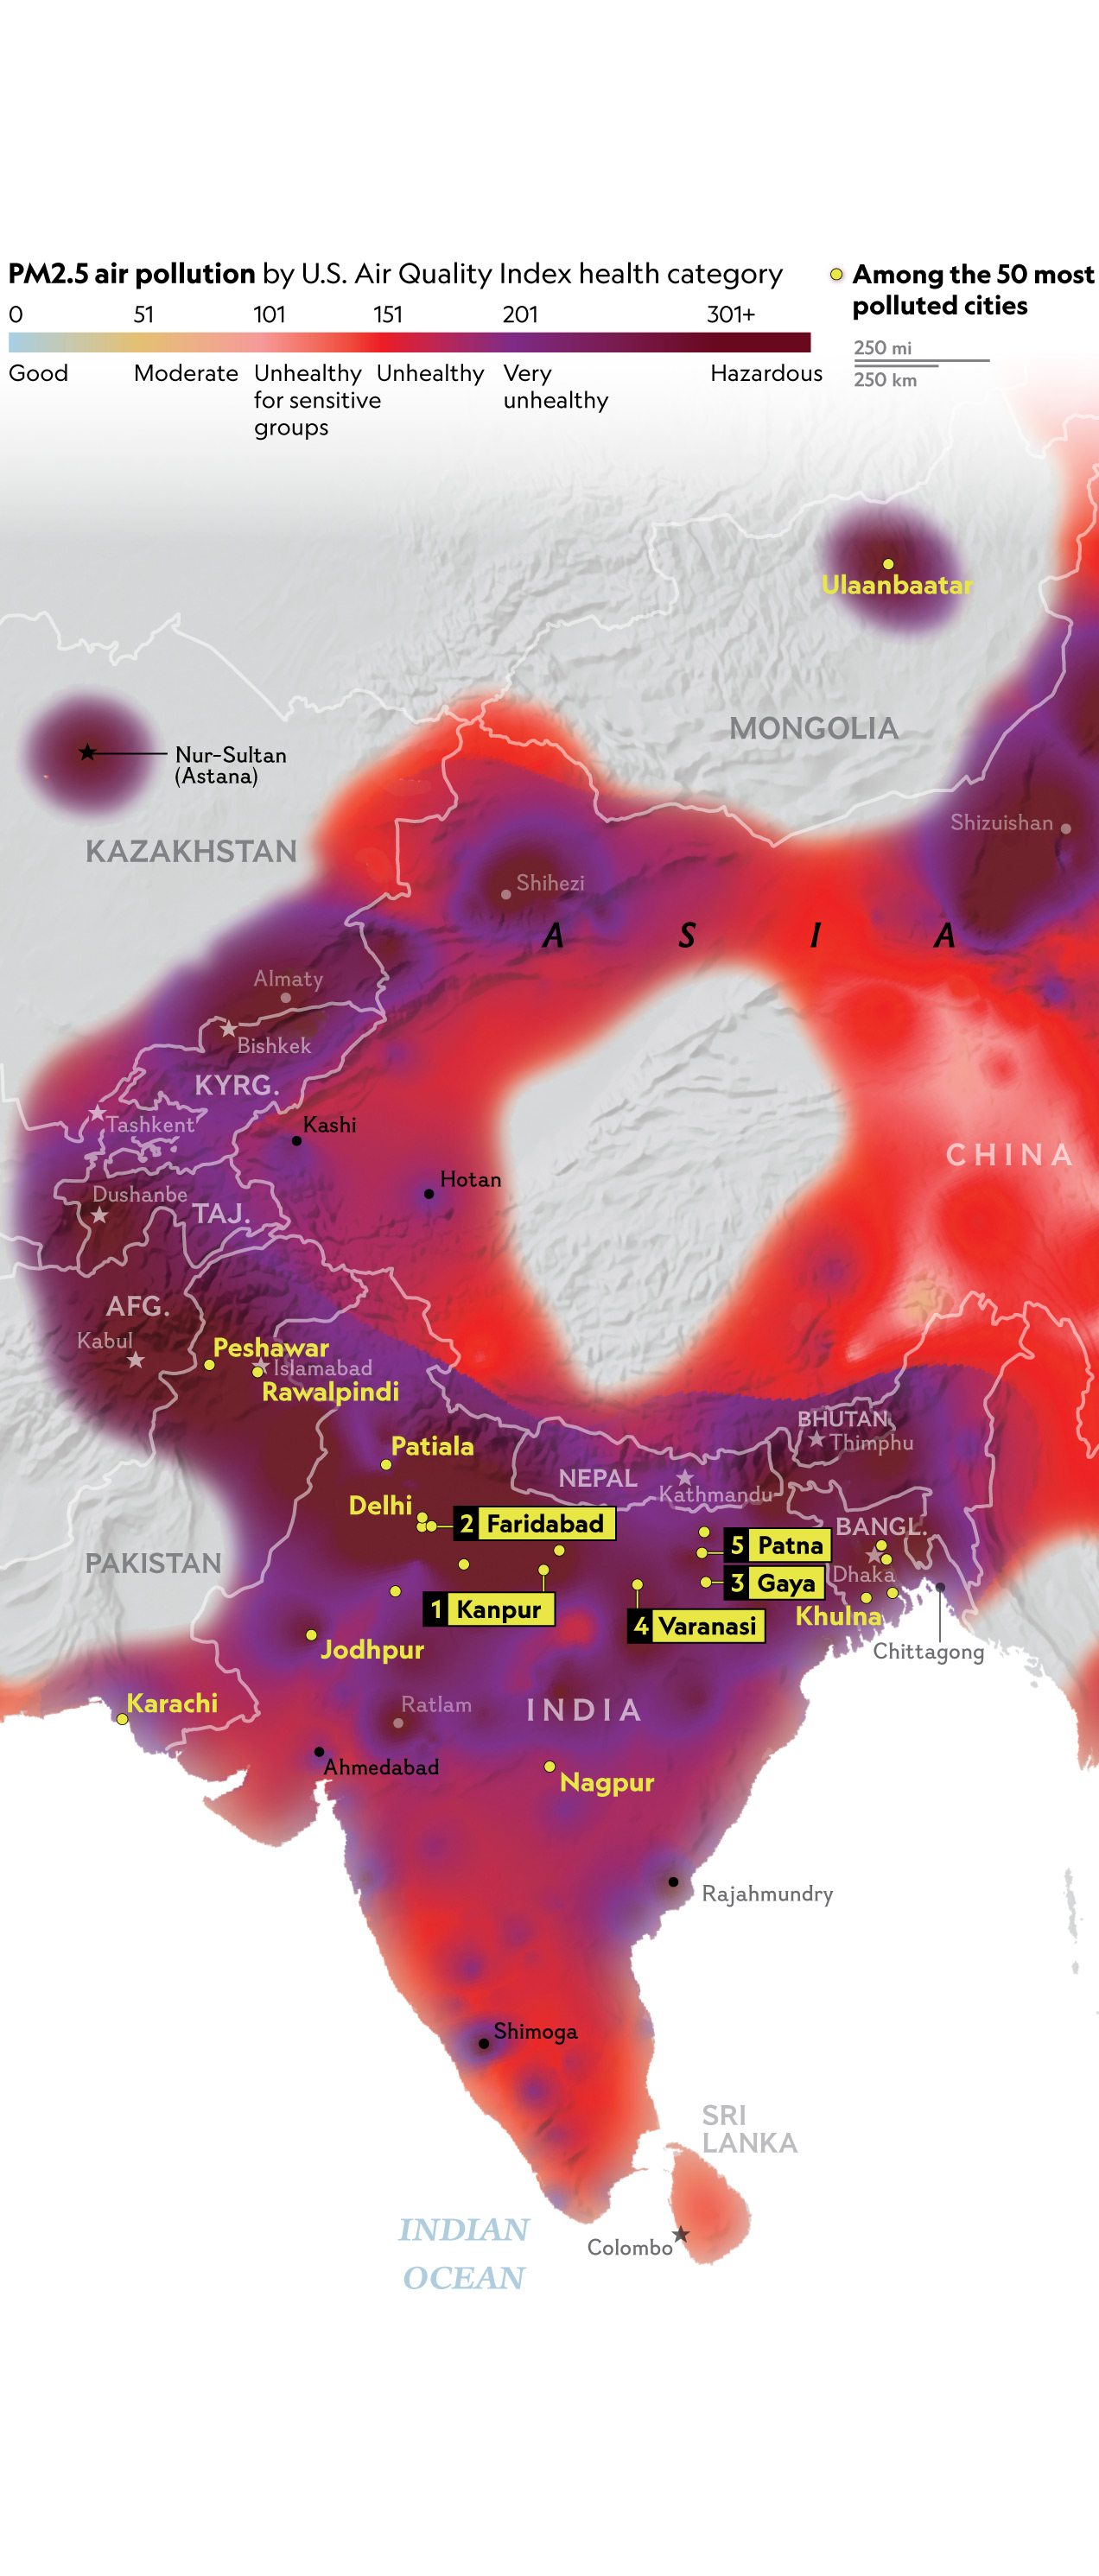
Disparity in the Air
People in some of the world’s most populous countries—China, India, Pakistan—breathe the most polluted air. This map shows readings of PM2.5, or fine-particulate matter, recorded over several months in 2020, with the highest readings selected for each place. Of the world’s 50 most polluted cities, nearly all are in Asia.
CHINA
Government action has decreased ambient levels of PM2.5 by 30 percent during the past decade, yet 1.4 million Chinese died of exposure to it in 2019. Coal and diesel fuel are key sources of PM2.5 here.
Gray areas have
insufficient surface
stations to estimate
air quality conditions.
PAKISTAN
With its large population and low standards for auto and industry emissions, Pakistan ranks second worst when it comes to PM2.5 exposure.
INDIA
Delhi’s skies are choked with annual PM2.5 levels nearly 10 times the target set by the World Health Organization.
RYAN MORRIS, NGM STAFF. SOURCES: BERKELEY EARTH; WORLD HEALTH ORGANIZATION; IQAIR; STATE OF GLOBAL AIR 2020
NOTE: THE MAP SHOWS A COMPOSITE OF THE HIGHEST PM2.5 READINGS FROM THOUSANDS OF SURFACE STATION MEASUREMENTS SAMPLED AT DAILY INTERVALS BETWEEN OCTOBER 2020 AND JANUARY 2021. THE DATA ARE EXTRAPOLATED TO CREATE AN ESTIMATE OF THE WORST AIR QUALITY CONDITIONS EXPERIENCED BY REGION. HEALTH CATEGORIES ARE BASED ON THE EPA’S STANDARD FOR 24-HOUR EXPOSURE.
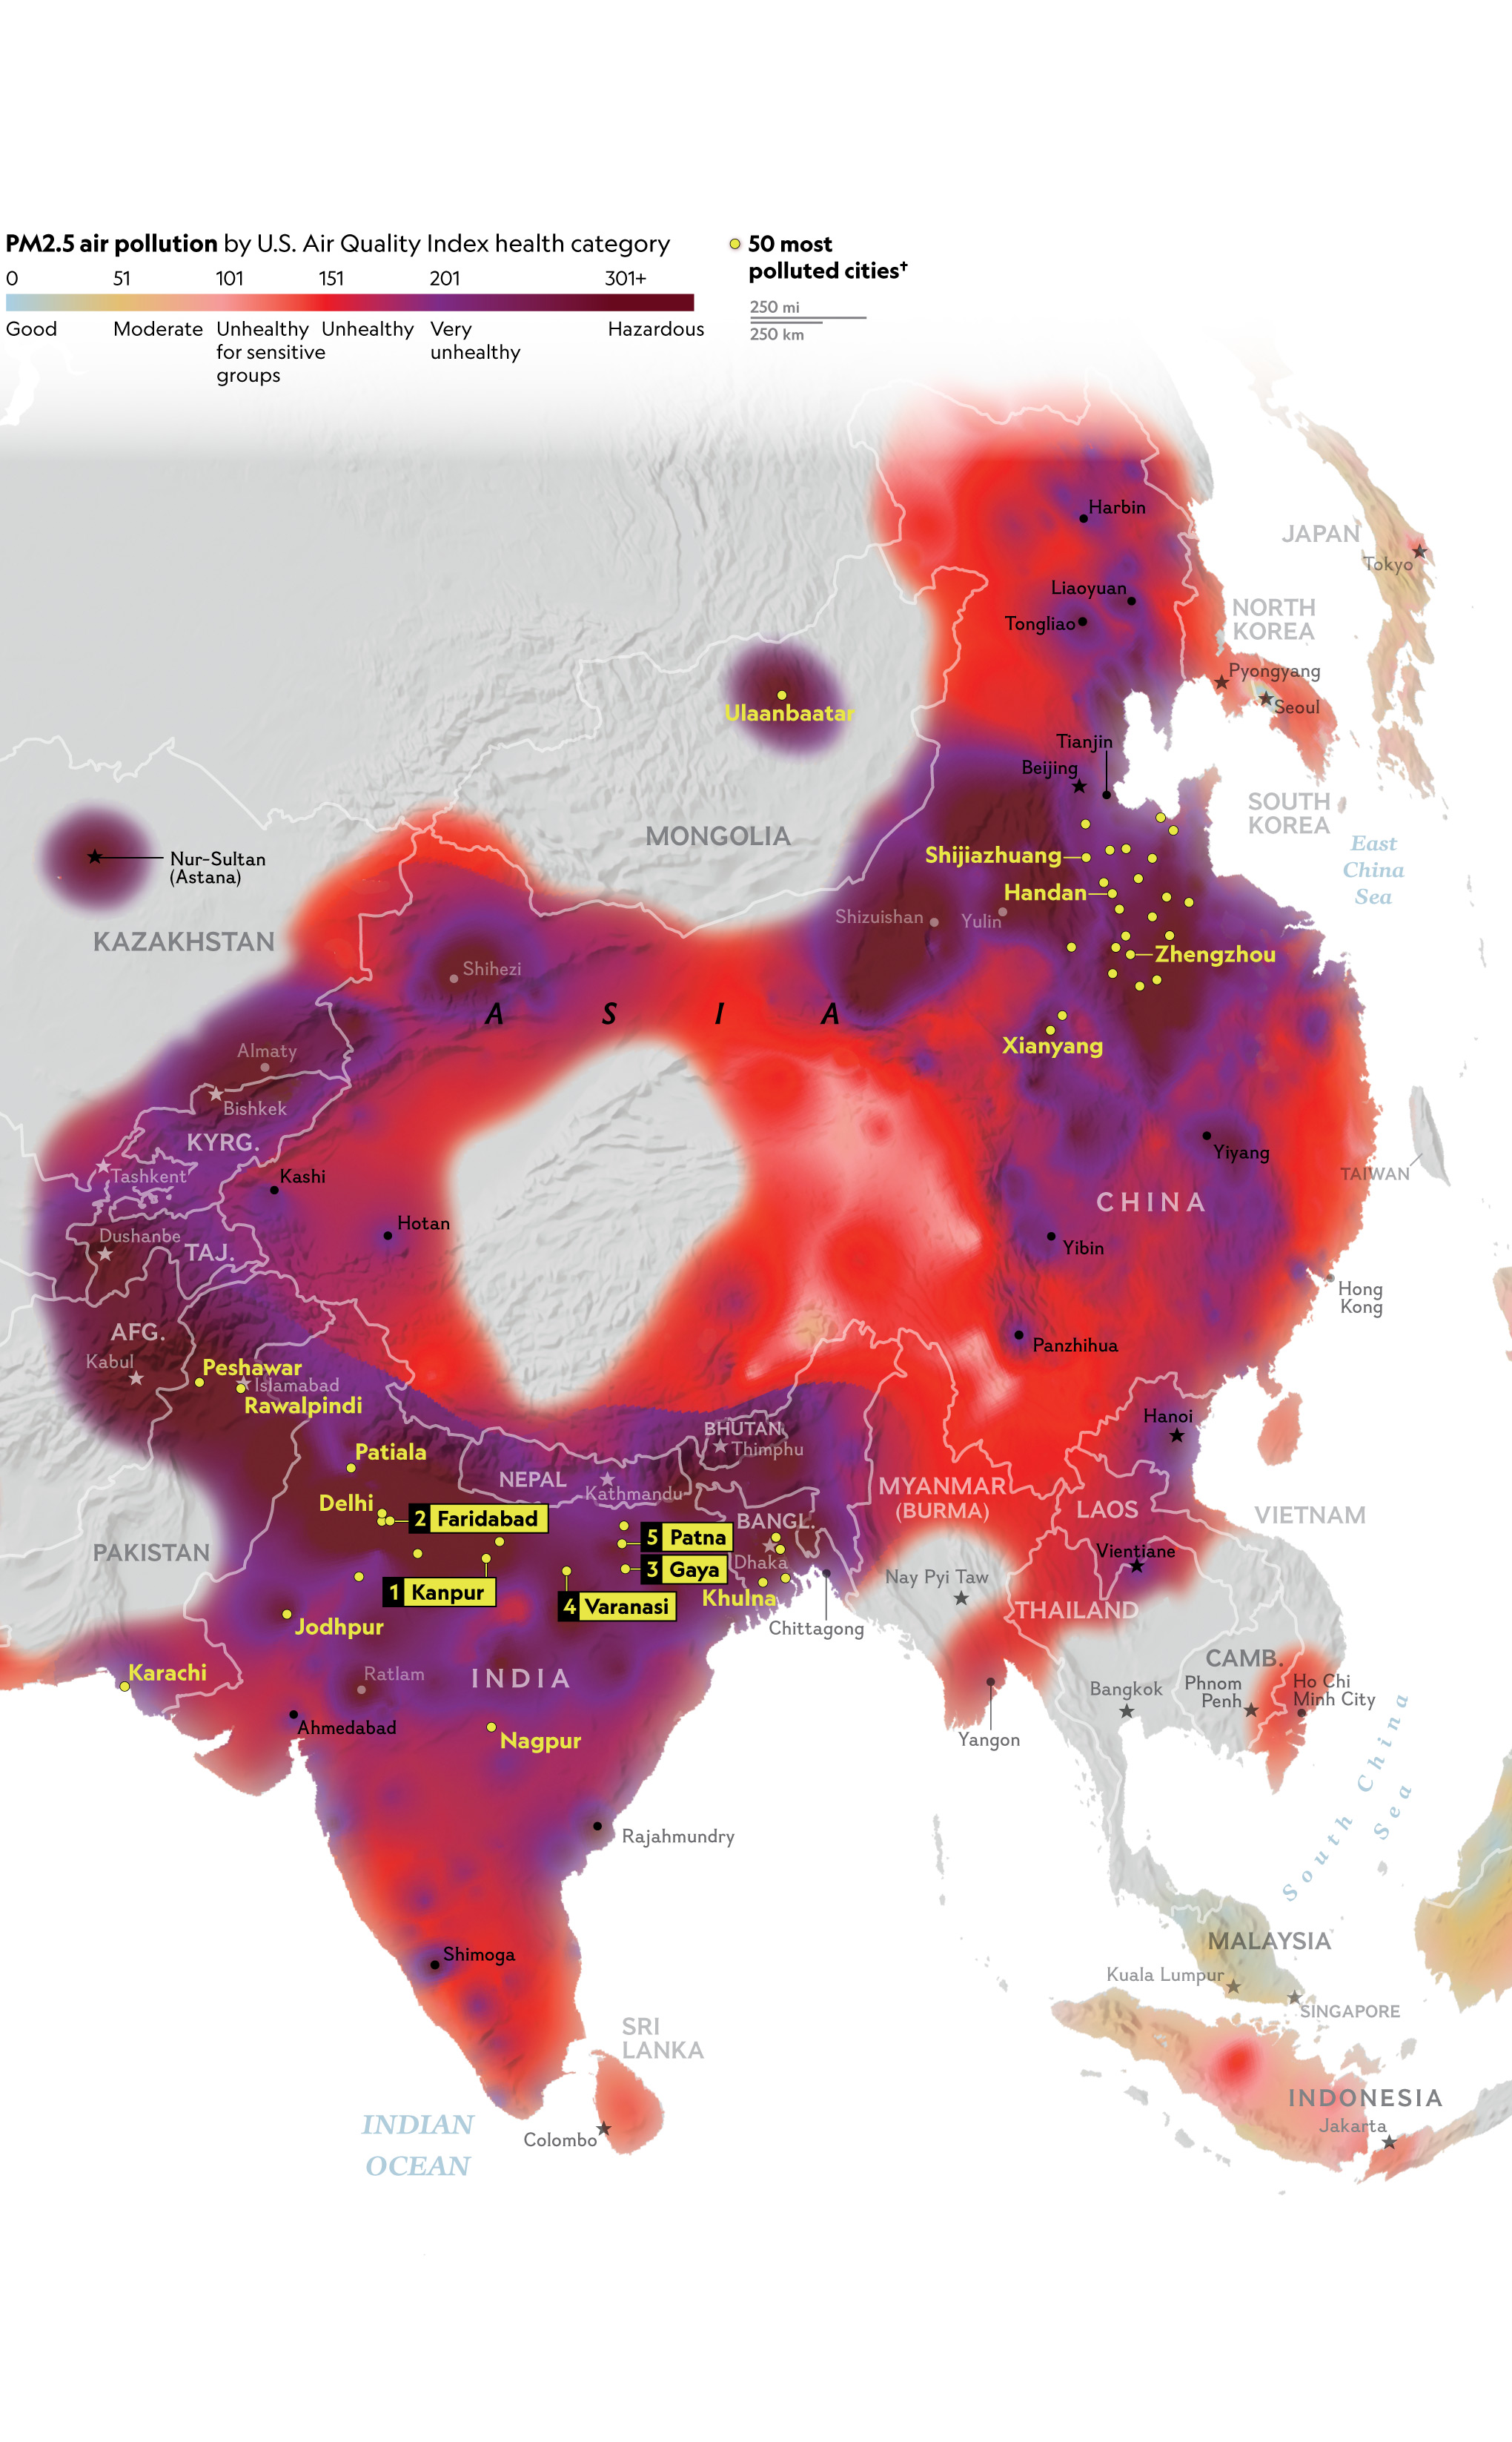
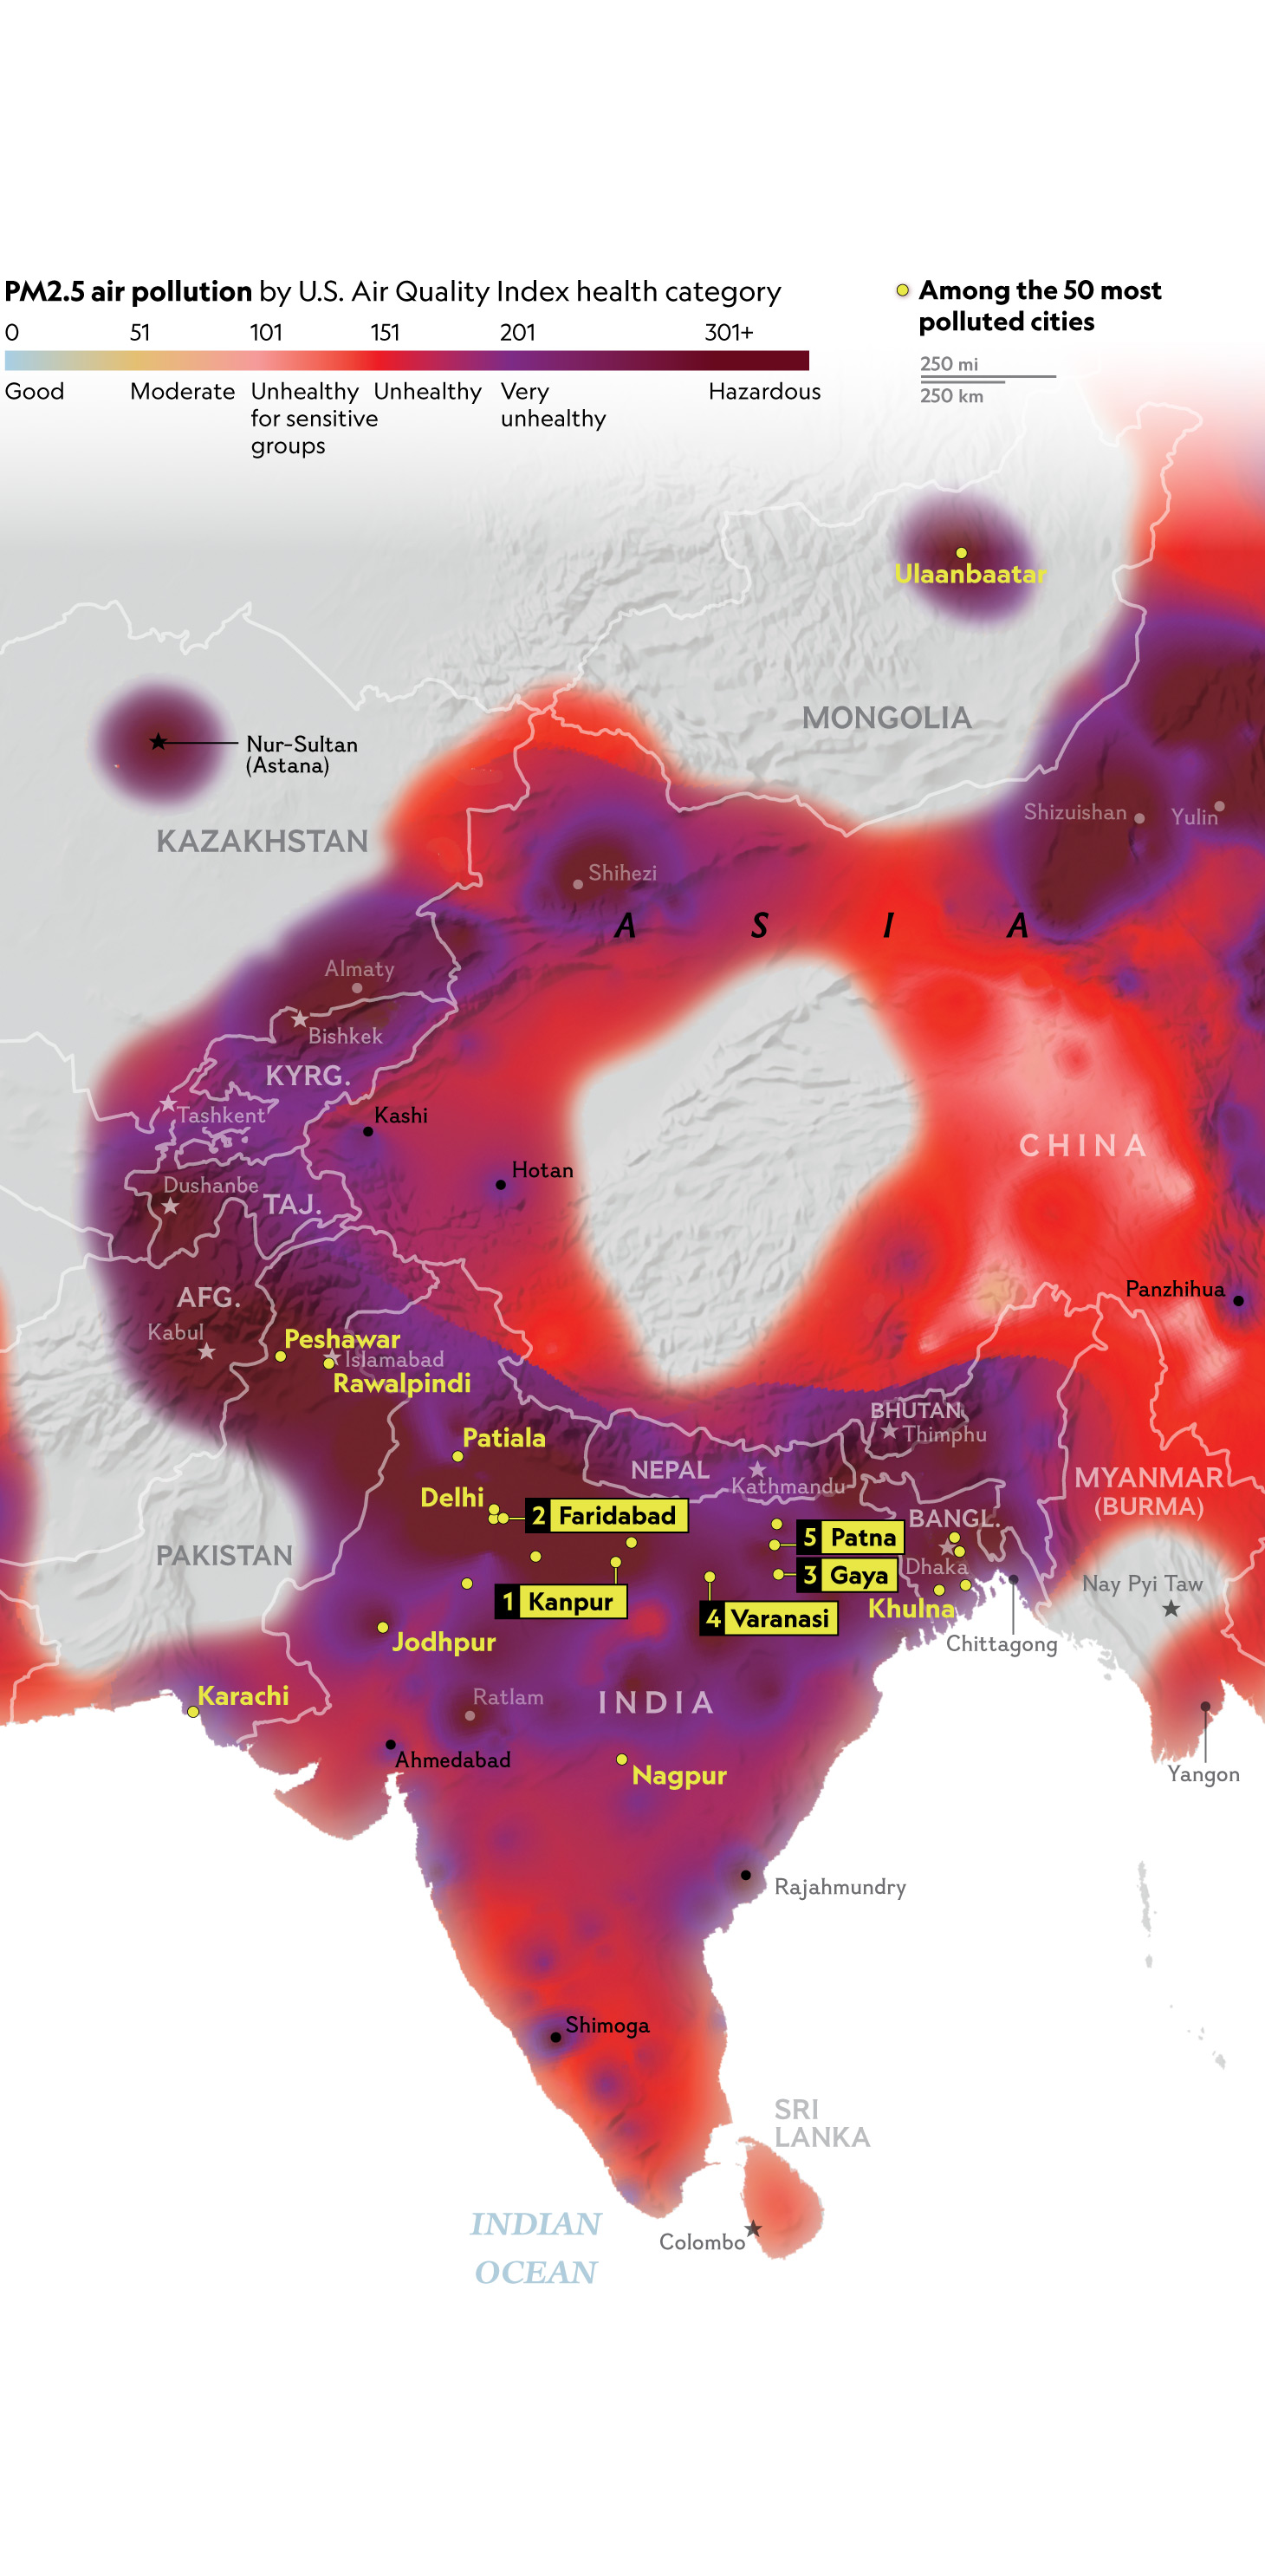
Disparity in the Air
People in some of the world’s most populous countries—China, India, Pakistan—breathe the most polluted air. This map of some of the most affected parts of the globe shows readings of PM2.5, or fine-particulate matter, recorded over several months in 2020, with the highest readings selected for each place. The geographic disparity is clear: Of the world’s 50 most polluted cities, nearly all are in Asia, though the exceptional wildfires in the western U.S. briefly led to similar pollution levels in 2020.
CHINA
Government action has decreased ambient levels of PM2.5 by 30 percent during the past decade, yet 1.4 million Chinese died of exposure to it in 2019. Coal and diesel fuel are key sources of PM2.5 here.
MONGOLIA
Ulaanbaatar, the capital, home to nearly 1.5 million, has some of the worst air pollution in the world—especially in winter, when many homes are heated by coal stoves.
Gray areas have
insufficient surface
stations to estimate
air quality conditions.
BANGLADESH
A leading risk factor for premature death, air pollution was responsible for around 20 percent of all deaths in Bangladesh in 2019.
PAKISTAN
With its large population and low standards for auto and industry emissions, Pakistan ranks second worst when it comes to PM2.5 exposure.
INDIA
Delhi’s skies are choked with annual PM2.5 levels nearly 10 times the target set by the World Health Organization.
RYAN MORRIS, NGM STAFF. SOURCES: BERKELEY EARTH; WORLD HEALTH ORGANIZATION; IQAIR; STATE OF GLOBAL AIR 2020
†BASED ON ANNUAL MEAN PM2.5 CONCENTRATIONS, ACCORDING TO WHO (LATEST DATA AVAILABLE). NOT SHOWN ON MAP: BAMENDA, CAMEROON; KAMPALA, UGANDA; AND YANBU, SAUDI ARABIA.
NOTE: THE MAP SHOWS A COMPOSITE OF THE HIGHEST PM2.5 READINGS FROM THOUSANDS OF SURFACE STATION MEASUREMENTS SAMPLED AT DAILY INTERVALS BETWEEN OCTOBER 2020 AND JANUARY 2021. THE DATA ARE EXTRAPOLATED TO CREATE AN ESTIMATE OF THE WORST AIR QUALITY CONDITIONS EXPERIENCED BY REGION. HEALTH CATEGORIES ARE BASED ON THE EPA’S STANDARD FOR 24-HOUR EXPOSURE.