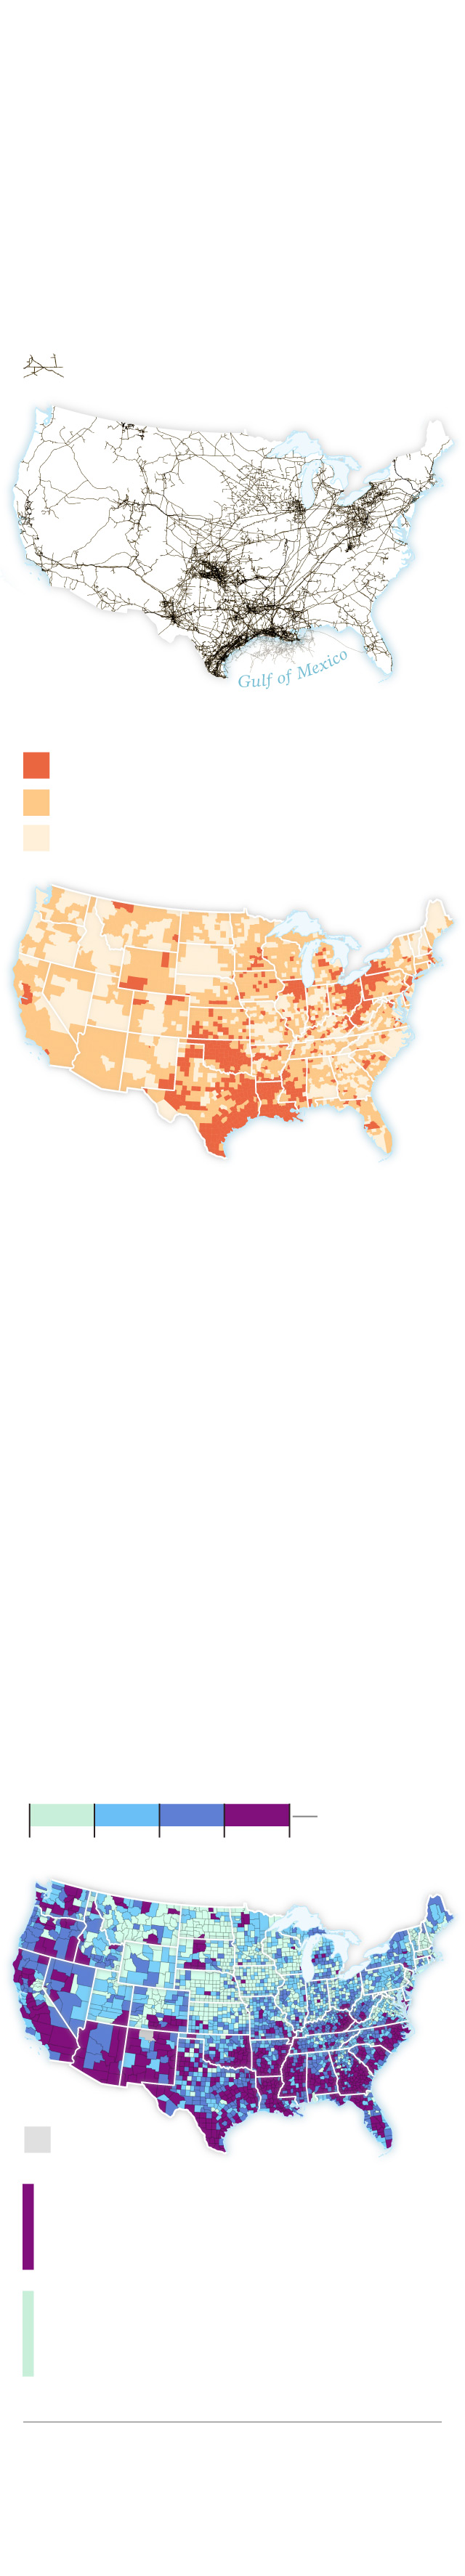
The United States has a massive network of natural gas pipelines.
The map below shows over 230,000 miles of major natural gas pipelines tracked by the U.S. Energy Information Agency. A new study measured the density of these pipelines in each county.
Natural gas pipelines
Pipeline density (per 100 square miles)
More than 10 miles
1–10 miles
Less than 1 mile of pipeline
Alaska has one BOROUGH with PIPELINE Data. There is no data available for Hawaii AND Puerto Rico.
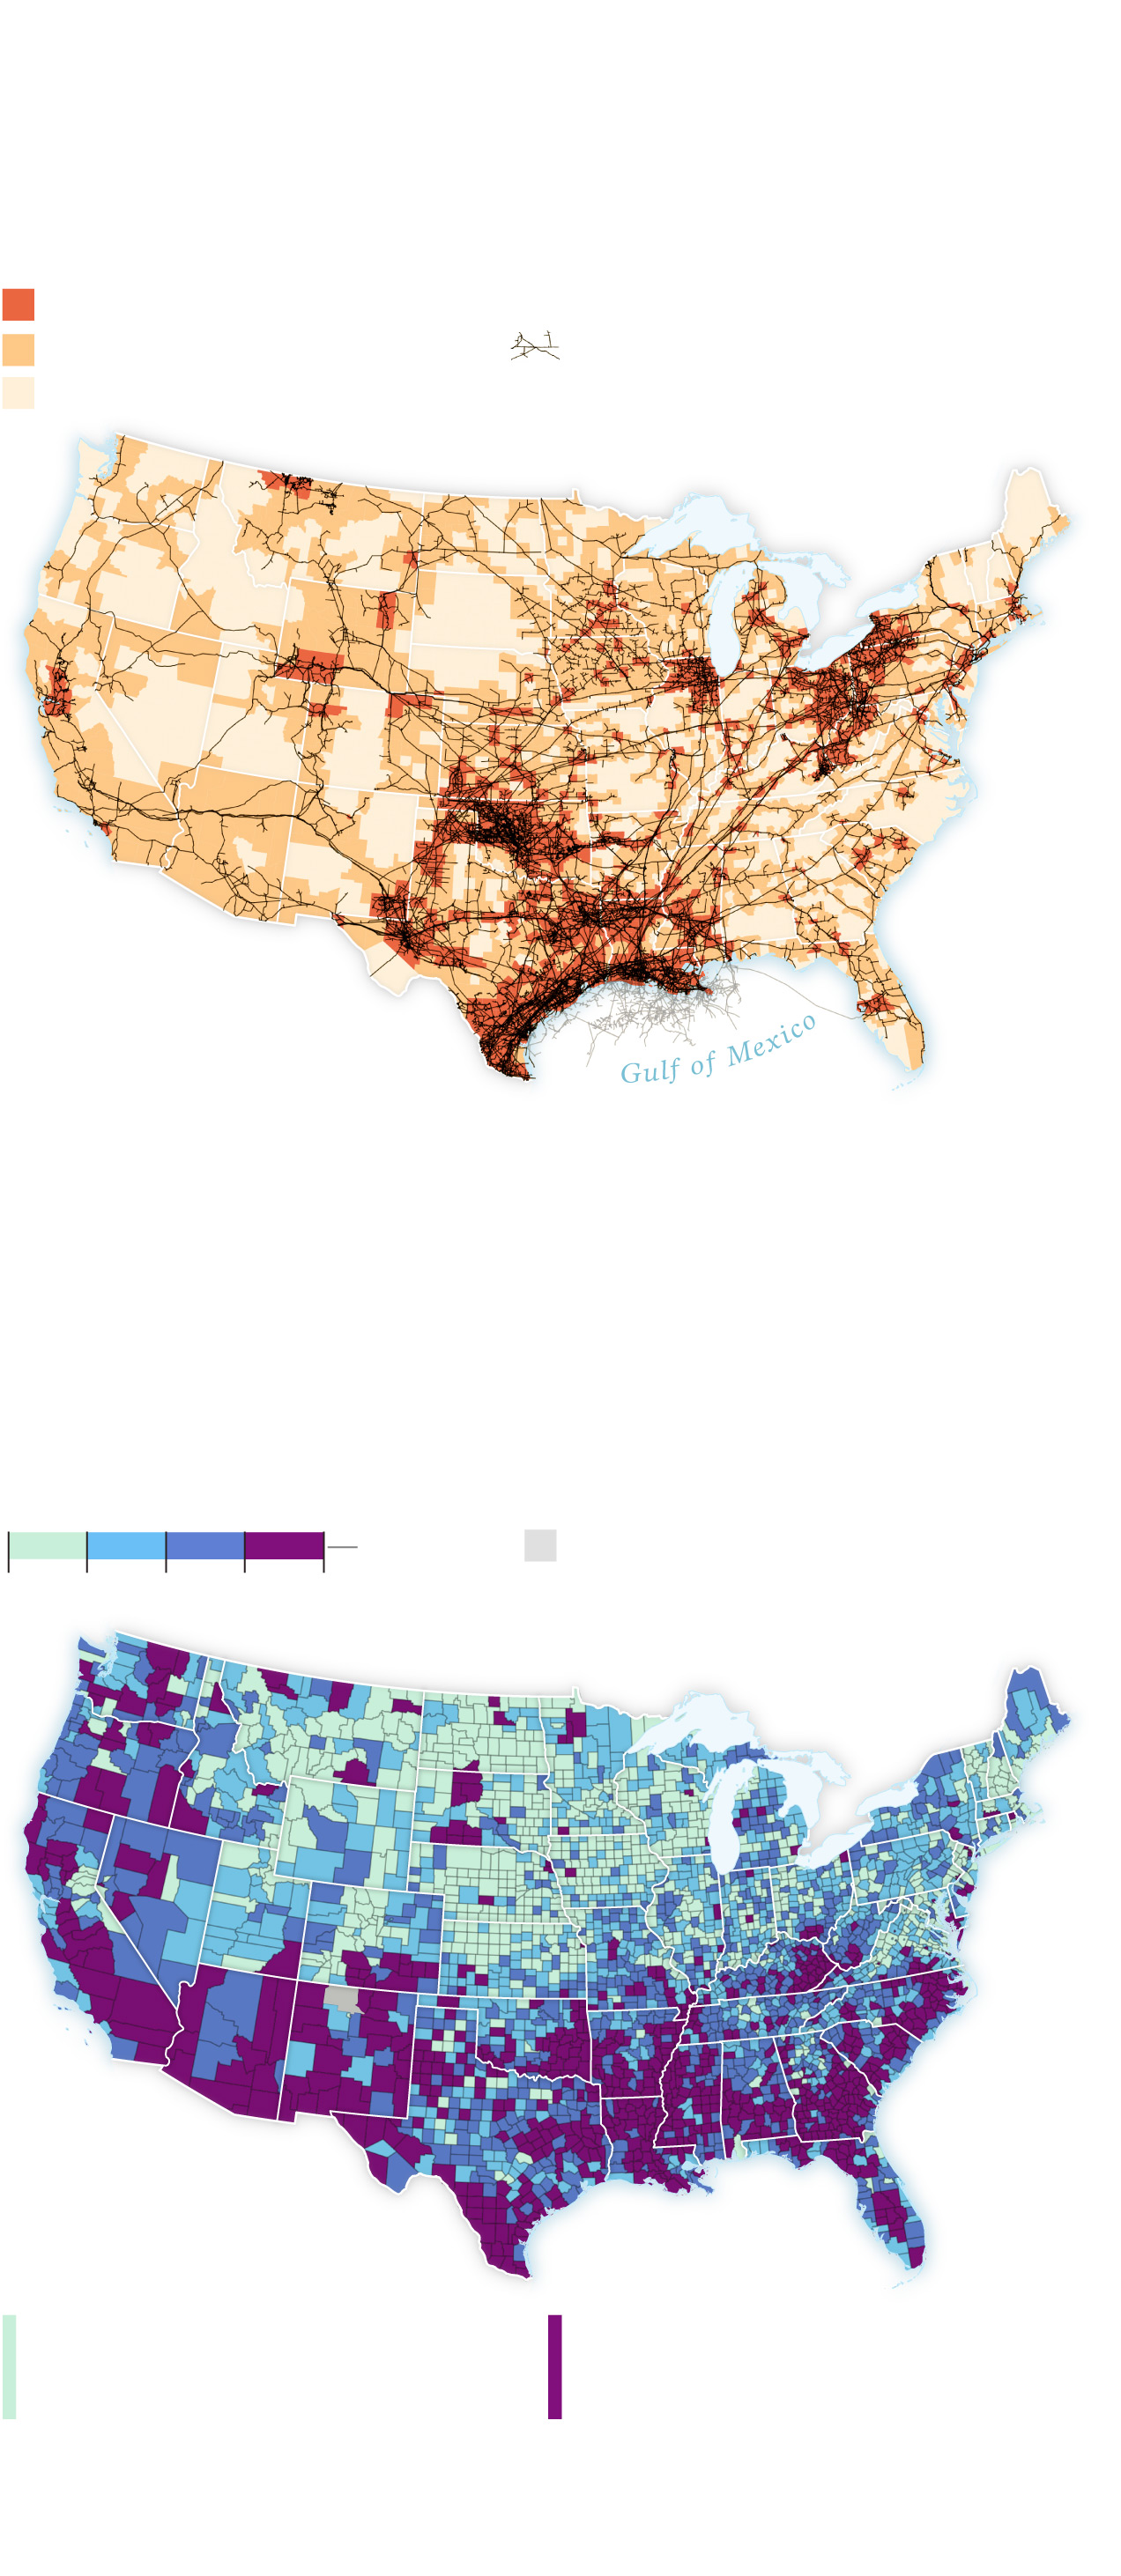
Counties with more vulnerable populations have more pipelines.
The study compared a county’s pipeline density to its Social Vulnerability Index score, which is calculated by the Centers for Disease Control and Prevention to assess a population’s capacity to cope with a disaster. The study found that more vulnerable counties (with a higher index score) have a higher density of natural gas pipelines.
Social Vulnerability Index (2018)
Most
vulnerable
quartile
0
0.25
0.5
0.75
1
No data
Counties in the least vulnerable quartile have an average of 7.2 miles of pipeline per 100 square miles.
Counties in the most vulnerable quartile have an average of 12.1 miles of pipeline per 100 square miles.
Riley D. Champine, NG Staff
Sources: Natural Gas Gathering and Transmission Pipelines and Social Vulnerability in the United States, Ryan E. Emanuel, North Carolina State University et al.; EIA
The United States has a massive network of natural gas pipelines.
The map below shows over 230,000 miles of major natural gas pipelines tracked by the U.S. Energy Information Agency.
A new study measured the density of these pipelines in each county.
Pipeline density (per 100 square miles)
More than 10 miles
Natural gas pipelines
1–10 miles
Less than 1 mile of pipeline
Alaska has one borough with pipeline Data. There is no data available for Hawaii AND Puerto Rico.
Counties with more vulnerable populations have more pipelines.
The study compared a county’s pipeline density to its Social Vulnerability Index score, which is calculated by the Centers for Disease Control and Prevention to assess a population’s capacity to cope with a disaster. The study found that more vulnerable counties (with a higher index score) have a higher density of natural gas pipelines.
Social Vulnerability Index (2018)
No data
Most
vulnerable
quartile
0
0.25
0.5
0.75
1
Counties in the most vulnerable quartile have an average of 12.1 miles of pipeline per 100 square miles.
Counties in the least vulnerable quartile have an average of 7.2 miles of pipeline per 100 square miles.
Riley D. Champine, NG Staff
Sources: Natural Gas Gathering and Transmission Pipelines and Social Vulnerability in the United States, Ryan E. Emanuel, North Carolina State University et al.; EIA